PostgreSQL performance monitoring, now with AI
Deploy in minutes and monitor one to several hundred PostgreSQL instances, on-premises, in any cloud or in containers.
Datasentinel collects thousands of metrics, and AI Connector lets you query them in plain language from the assistant you already use.
Trusted by Leading Companies


Meet AI Connector:
Your PostgreSQL Expert, in Any AI Assistant
Ask in Plain Language
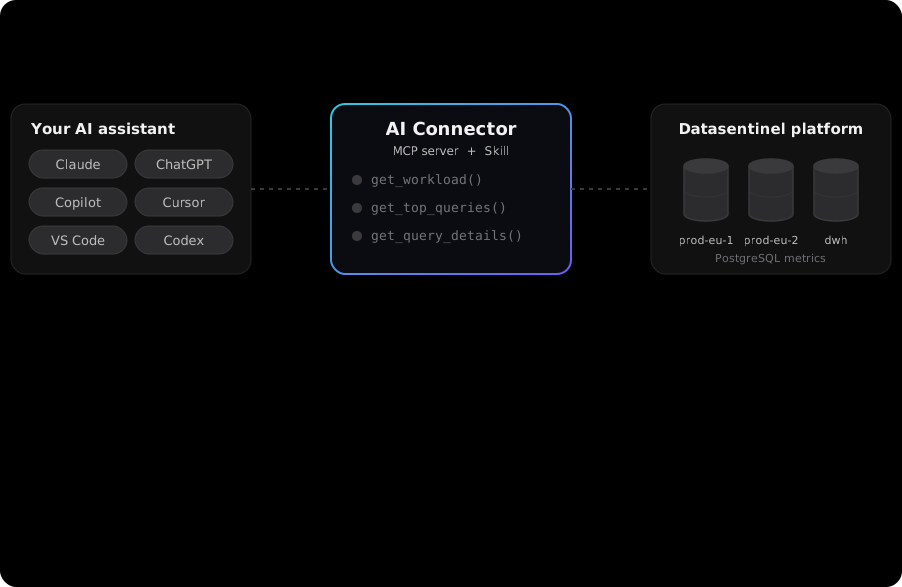
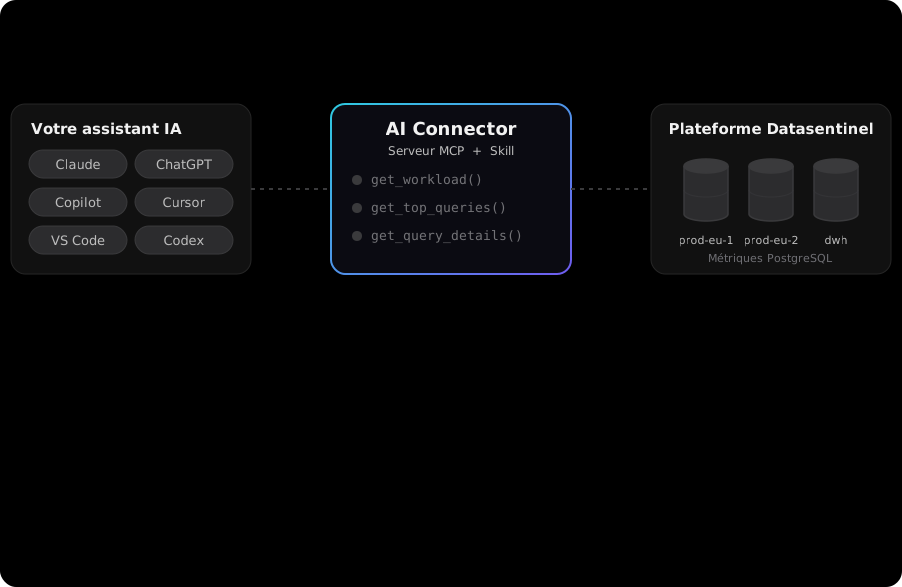
AI Connector opens Datasentinel to the AI assistant you already use: Claude, ChatGPT, Microsoft Copilot,Cursor, VS Code and many more.
Ask your question as you would ask a colleague. The assistant calls Datasentinel through our MCP server, guided by the Datasentinel Skill
It reads the same data as your dashboards. Answers come back as findings ordered by impact.
Each one carries a concrete recommendation and its expected gain, quantified from your own metrics.
You choose the assistant and its model. AI Connector works with any MCP-capable one.
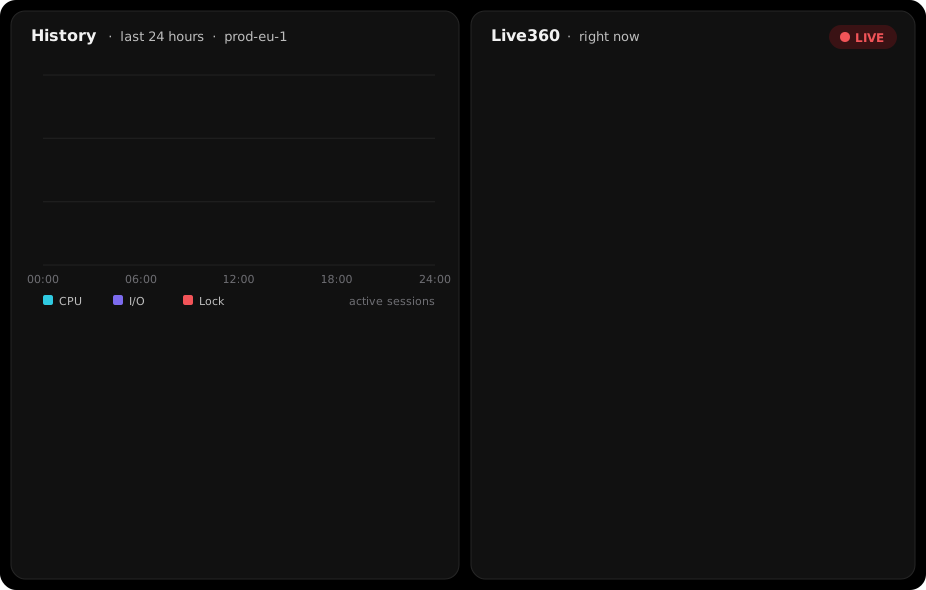
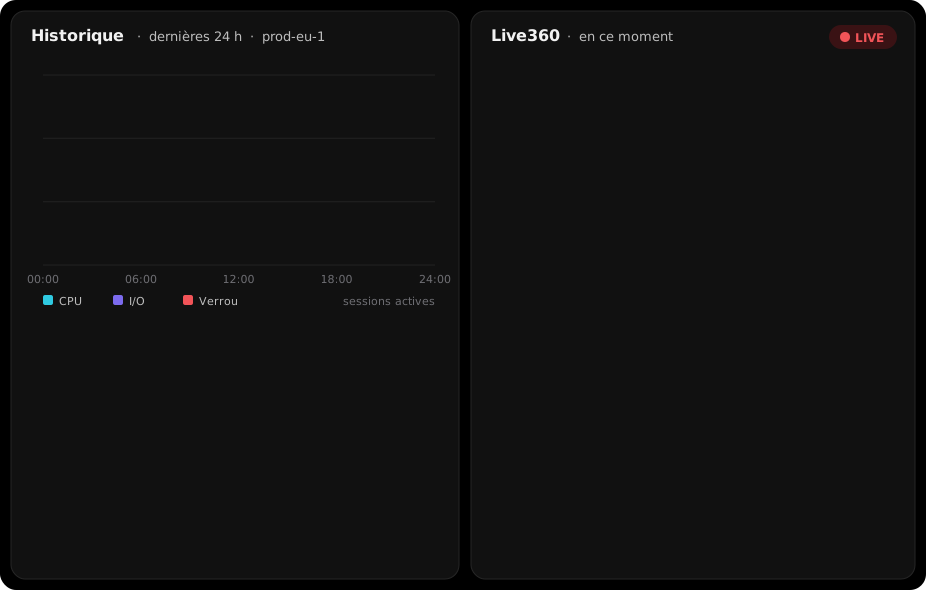
Troubleshoot the Past and the Present
Investigate what happened last night, or what is happening right now.
For past incidents, the assistant works from the history Datasentinel already collected.
It isolates the spike, names the waits and the root blocker, and points to the queries involved. On one instance, or on a whole set of instances selected by tag.
For live issues, it uses Live360 to inspect current sessions, blocking chains and running maintenancein real time.
It can also compare two periods to pinpoint a regression after a release or a parameter change for example.
Answers for Every Audience
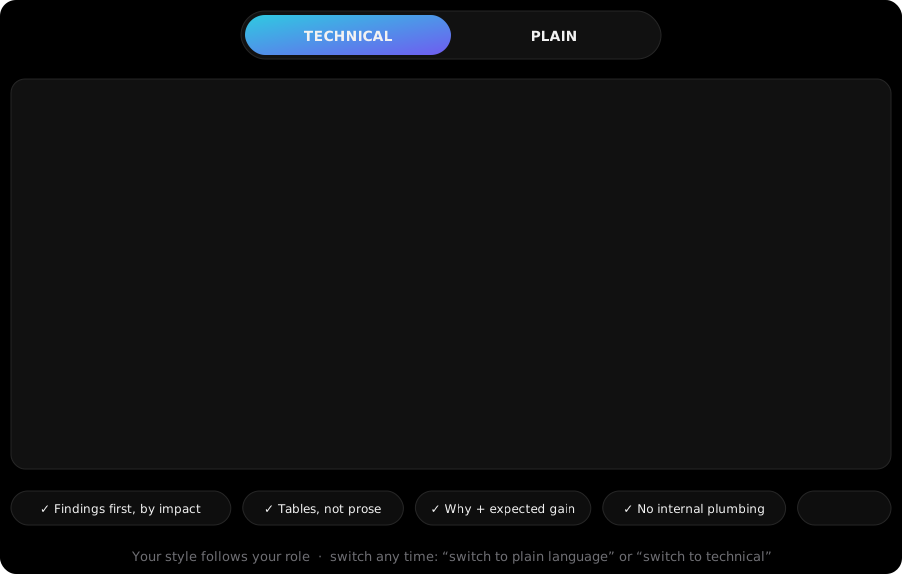
Every answer is written for its reader, in one of two styles.
TECHNICAL, for DBAs and anyone fluent in PostgreSQL: the PostgreSQL vocabulary, full measurements, and the exact operation with its cost.
PLAIN, for developers and everyone else: plain language, the impact on the application, the actions they own, and a ready-to-send escalation for the rest, with the evidence attached.
The style follows the user's role on the platform and switches in one sentence: "switch to plain language", "switch to technical". The assistant always replies in the user's language.
Performance analysis is no longer reserved for experts. Application teams can act on it too.
Secure and Read-Only by Design
Opening your metrics to AI never opens your databases.
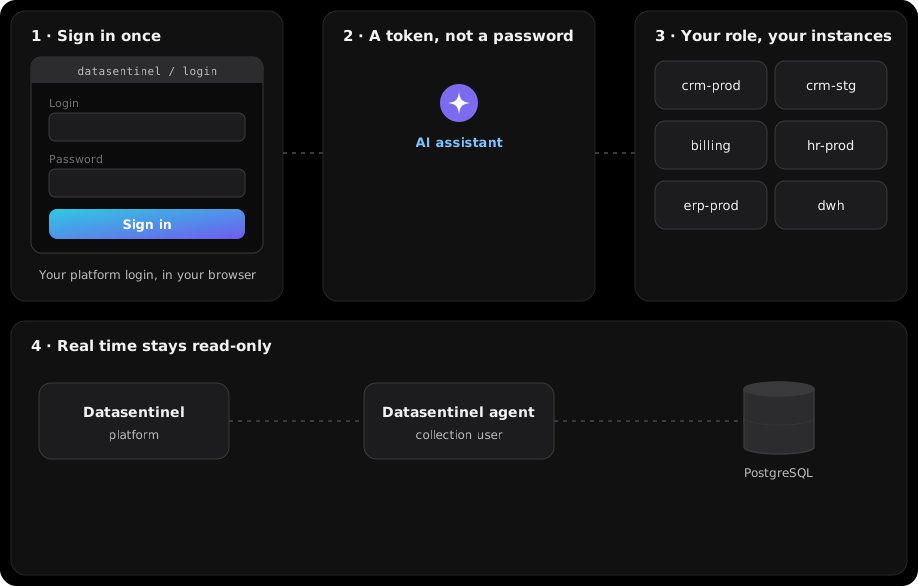
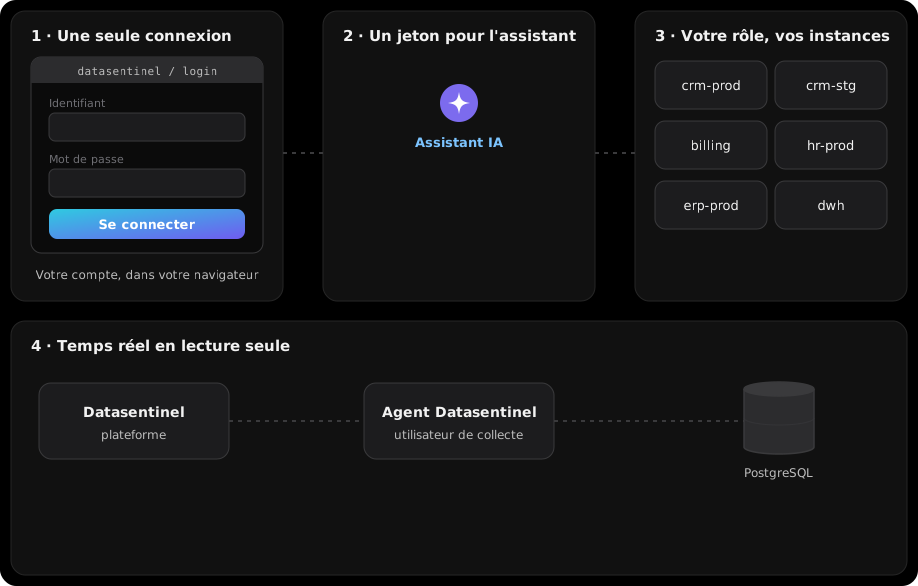
Users sign in once, in their browser, with their Datasentinel login (OAuth 2.1). The assistant receives a token, never a password, and never any PostgreSQL credential.
Each user sees only the instances their role allows (RBAC). Real-time analysis requires the Live360 right, and runs only a few read-only queries through the Datasentinel agent.
Nothing is ever written to your PostgreSQL clusters
Reports, Dashboards and Automation
Turn any analysis into a deliverable: an interactive HTML report, a Markdown summary for your wikior ticket, or a PDF report generated by the platform.
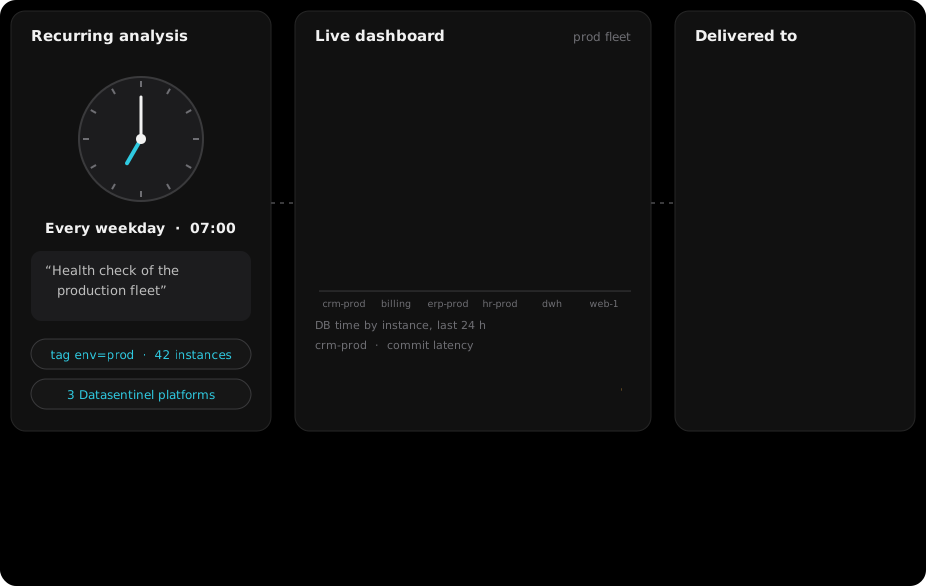
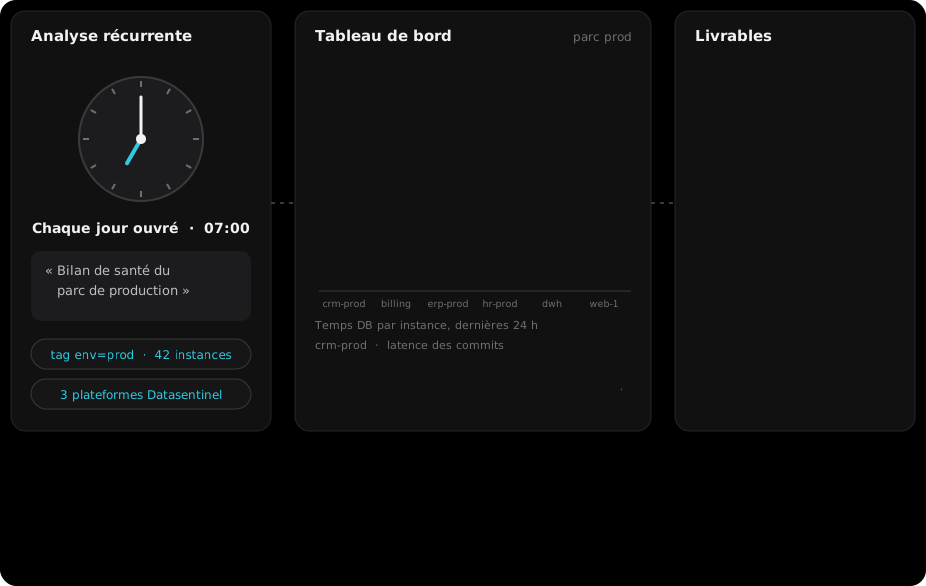
Build live dashboards in the assistants that support them.
Schedule recurring analyses, such as adaily health check of the production fleet or a weekly digest.
Connect several Datasentinel platforms to a single assistant.
Developers can go further with their own Python agents (or other): open a ServiceNow incident with the analysis attached, or keep the model fully on your own hardware.
Remote Monitoring
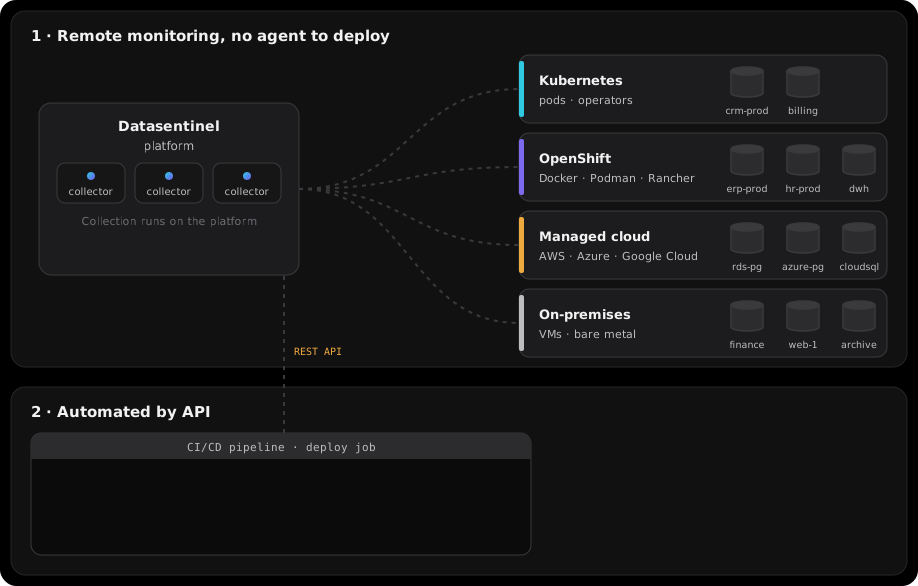
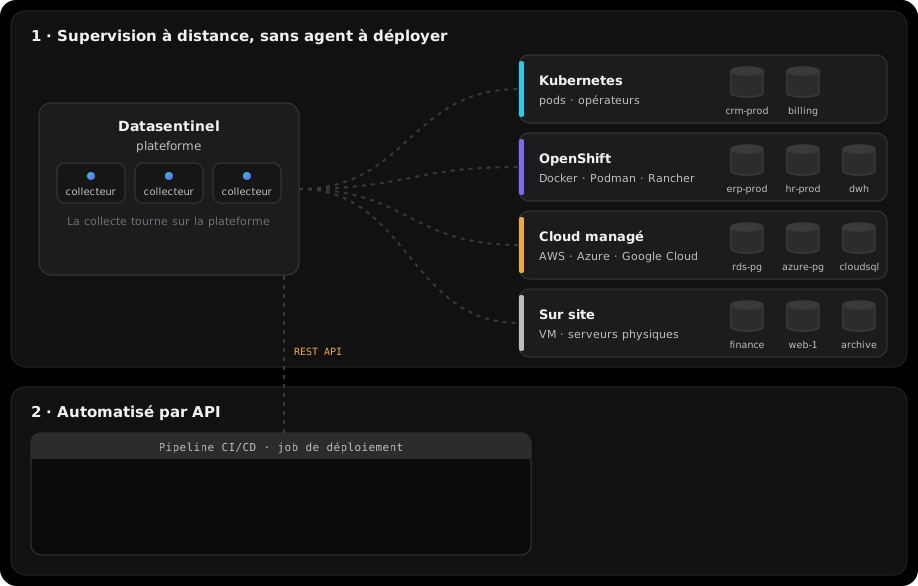
Datasentinel enables agentless monitoring of PostgreSQL clusters running in Kubernetes, OpenShift, and other containerized platforms.
Designed for dynamic infrastructure, Datasentinel connects remotely to your PostgreSQL instances — no sidecars or in-cluster agents required.
Configuration can be fully automated via API, supporting seamless integration in CI/CD pipelines.
Agentless monitoring is also fully supported for on-premises PostgreSQL deployments, providing a unified monitoring approach across hybrid environments.
Open source Extensions
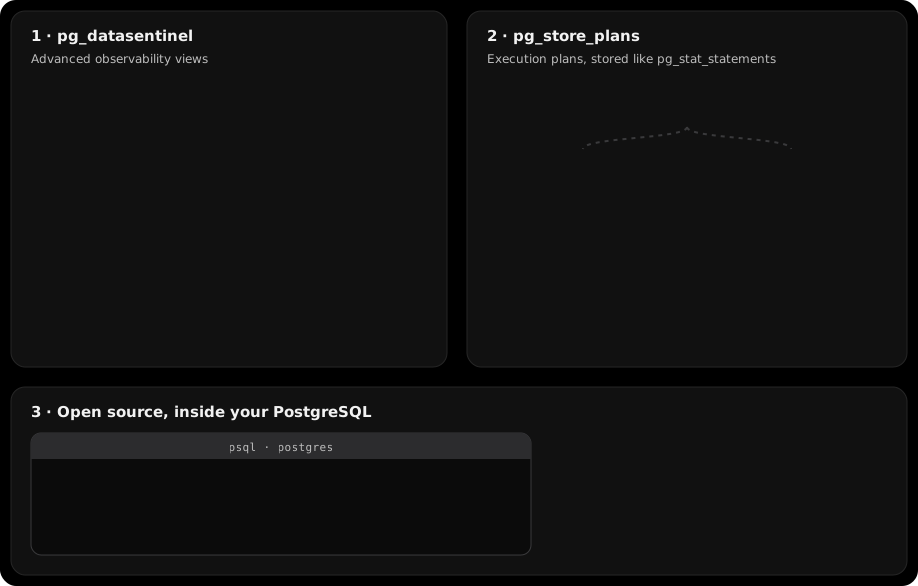
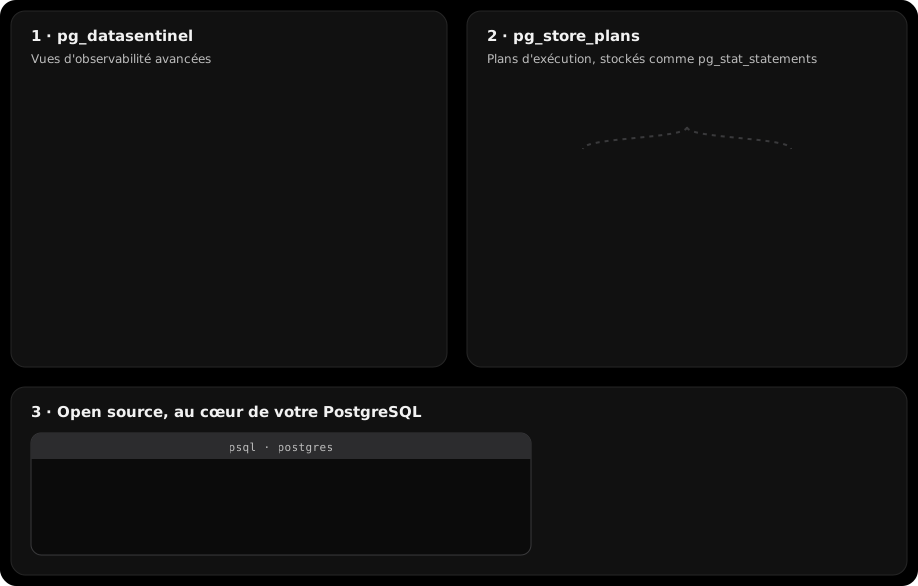
We contribute to the PostgreSQL ecosystem through open source extensions focused on observability and performance troubleshooting.
pg_datasentinel extends PostgreSQL with advanced observability views, adding insights into memory usage, temporary files, checkpoints, vacuum and analyze activity, and wraparound risk.
We also maintain pg_store_plans, a Datasentinel fork of the original project. It stores execution plans in PostgreSQL, similar to how pg_stat_statements stores query statistics, while adding Datasentinel-specific fixes and compatibility improvements.
Key Features for Optimal Performance

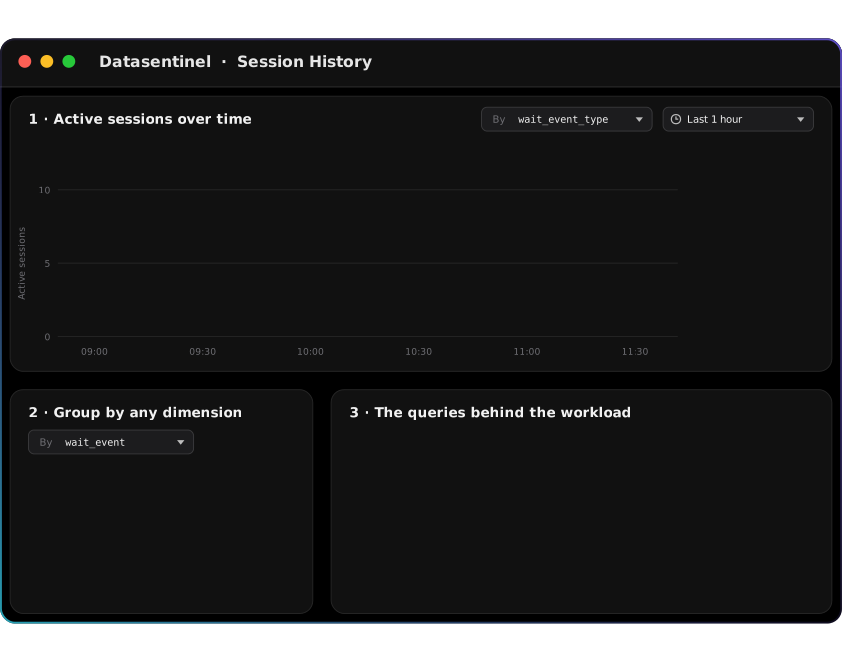
Session History
Comprehensive Active Session History Timeline for Enhanced Database Performance Insights
Top Queries
Pinpoint and Optimize Your Top Queries

Lock Explorer
Continuously monitor lock activity and quickly identify any blocking session issues

Alerting
Comprehensive monitoring and notification capabilities

Live 360
Instant Access to your clusters for Real-Time Monitoring

Reporting
Comprehensive Reporting for Customizable Analysis

Top Tables & Indexes
Explore your most accessed tables and indexes in detail

Cluster & System Metrics
Comprehensive Collection of Cluster and System Metrics for In-depth Analysis
Availability
Rapid setup and immediate availability regardless of the chosen configuration

On-premises
- Security Policy Compliance
- Manage and upgrade Datasentinel
- Available in less than 5 minutes
- Data stored in your datacenter
- Agent-based or Agentless

SaaS
- No infrastructure investment
- Automatic updates
- Data stored securely
- Available in less than 5 minutes
- Scalable infrastructure
- Agent-based
Management
Fine-grained user management with Role-Based Access Control
All-in-One Monitoring Solution
Seamlessly integrating with and automating your PostgreSQL environment for efficient and comprehensive oversight

Compatibility
Datasentinel offers comprehensive monitoring and performance tuning for a wide range of PostgreSQL-compatible databases.
Our tool adeptly handles diverse environment, whether you're utilizing traditional on-premises databases or embracing the flexibility of cloud-managed databases, ensuring optimal performance across both native PostgreSQL systems and cloud-based solutions.

Automation
Experience Seamless Automation and Integration with Our API-First Design.
Effortlessly manage agentless connections, roles, and users, while customizing alerts and reports.
Ideal for streamlined deployment in DBaaS environments.
FAQs
We have compiled a list of commonly asked questions to help you better understand Datasentinel and its features.

Datasentinel is compatible with a wide range of PostgreSQL versions, starting from version 9.4 up to the latest release.
We continuously update our software to maintain compatibility with new PostgreSQL versions as they are released, ensuring that our users always have access to the latest features and improvements.
Yes, Datasentinel requires the installation of the pg_stat_statements extension for optimal functionality. Th extension is part of the official PostgreSQL contrib package, making it easy to install.
In addition to pg_stat_statements, Datasentinel can also take advantage of other optional extensions to enhance its capabilities further. While these additional extensions are not mandatory, they can provide more in-depth insights and functionalities. For more details on these optional extensions and how they can benefit your PostgreSQL database monitoring experience, please refer to our Documentation
The licensing for Datasentinel is based on an annual subscription model.
This approach ensures continuous access to the latest features and support, providing an ongoing, optimal monitoring experience for your PostgreSQL databases.
The cost of the subscription is calculated based on the number of instances (clusters) you wish to monitor. We have implemented a decreasing rate structure, which means the per-instance cost reduces as the number of instances increases.
This pricing model is designed to be cost-effective and scalable, accommodating the needs of both small-scale and large-scale database environments.
For detailed pricing information, please contact our Sales Team.
Absolutely! We offer a comprehensive 60-day Free Trial.
During this trial period, you have full access to all of Datasentinel's features without any limitations on the number of instances you can monitor.
Whether you prefer to use Datasentinel on-premises or in a SaaS (Software as a Service) mode, the trial provides a complete experience of our software's capabilities.
To initiate your free trial, just Contact Us.
Our team will guide you through the setup process, enabling you to explore every aspect of Datasentinel's functionality.